

What is it?
A browser-based debugger that opens in a new browser tab which allows you to see a breakdown of the rendering process the page went through with some useful information such as duration and items accessed that is useful for diagnosing which renderings are taking a long time. By default, the debugger resolves requests to the home page of the web database.
What is not it?
This is definitely not the ultimate tool to debug a performance issue in Sitecore. This is just another tool we can use while searching for the performance leak we are having. There are other great tools we can use for searching memory leak likes “dot trace” and “ANTS Memory Profiler” that can also point us in the correct controller or class with the leak.
I will just consider Sitecore Debug as another way to confirm the culprit class or to give us more information about a particular rendering and also because it is just important that we as Sitecore developers know what this is about.
How to use it?
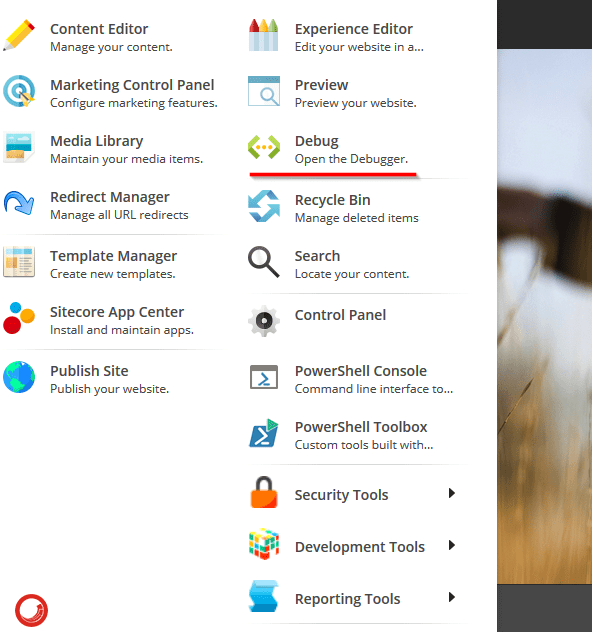
So, let’s start by knowing you can access it by just clicking the option in the menu of the Sitecore Desktop.
You will see then a smaller version of the Experience Editor, where you can see and even navigate across your site but in addition you will be able to see diagnosis info at the end of the page.

There are different options you have in the menu that are important to mention:
- Mode: obviously it will be set to Debug by default, but you can go to the regular Experience Editor by just clicking on “Edit”.
- Profile: it is activated by default, but again you can disable if needed; but most importantly, you can download the diagnostic info generated here.
- Trace: activated by default, provides a more detailed information of the steps involved in the page generation process. You can also download the info for further analysis.
- Rendering: You can enable or disable Borders (renders borders around presentation components) and enable or disable Information (render information icons for each presentation component, which includes its profile, cache settings and output).
- Open: you can access the standard ASP.NET Trace

References
